Resolution Description | Overview This report includes the survey items administered to students enrolled in your class and the students’ responses. Rating scale items were answered on 5-point rating scales, with higher numbers denoting better ratings. Open-ended questions asked students to respond in their own words. Sections of the Report Overall Indicator Section: Four primary indicators, 1) Course Average, 2) Instructor Average, 3) Course Global, and 4) Instructor Global, summarize the rating scale responses. For each indicator, your average is depicted on the horizontal bar. Your average (av.) is presented again to the right of the bar, along with the standard deviation (dev.) for your class.
Course Average:
The average score of the nine individual course items, averaged across students. Instructor Average:
The average score of the ten individual instructor items, averaged across students. Course Global:
The average score of the single global course item (i.e., How would you rate this courseoverall?) Note: this score is not used when calculating Course Average. Instructor Global:
The average score of the single global instructor item (i.e., How would you rate this instructor's teaching effectiveness overall?) Note: this score is not used when calculating Instructor AvgCourse Information: Provides information about the types of students enrolled in the class. Individual Item Sections: Please refer to the Legend, depicted below, when interpreting responses to individual items. 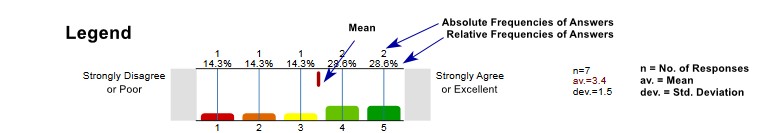 About the Course Section: About the Course Section:
Responses to individual course items are presented in this section, including the Course Global single item. About the Instructor Section:
Responses to individual instructor items are presented in the section, including Instructor Global single item. Profile Line for Overall Indicators: This graph allows you to compare your average rating on each overall indicator with the corresponding university average for each overall indicator. Your average ratings are connected by a line; the university average ratings are connected by a different line, as described in the report. To the right are your and the university’s averages (av.) and standard deviations (dev.) for each indicator. Profile Line for Individual Items: This graph allows you to compare your individual item average to the corresponding university average for that item. Your average ratings are connected by a line; the university average ratings are connected by a different line, as described in the report. To the right are your and the university’s statistics in numeric form (i.e., n=number of students who responded; av. = average). Comments Report: These list students’ written or typed responses to the course and instructor open-ended questions. Both questions ask students to provide their perspective about the positive aspects of the course or instructor, respectively, as well as to provide suggestions for improvements. |
|
|---|